Official MT.gov DNRC Streams App
The DNRC StAGE app takes the real-time data generated by the many sensor stations across the state and consolidates it within an easily navigable interface.
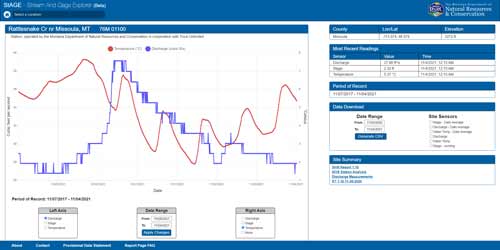
Generate line charts and CSV files on demand with the desired mix of measured properties and timespan. The double y-axis charts allow for comparison of properties over a period of time.
I wrote the app with react using the useReducer and useState hooks for state management. All code is from scratch with the exception of the chart.js library for the line charts. I styled everything manually with styled-components, and used the axios library for data fetching.

